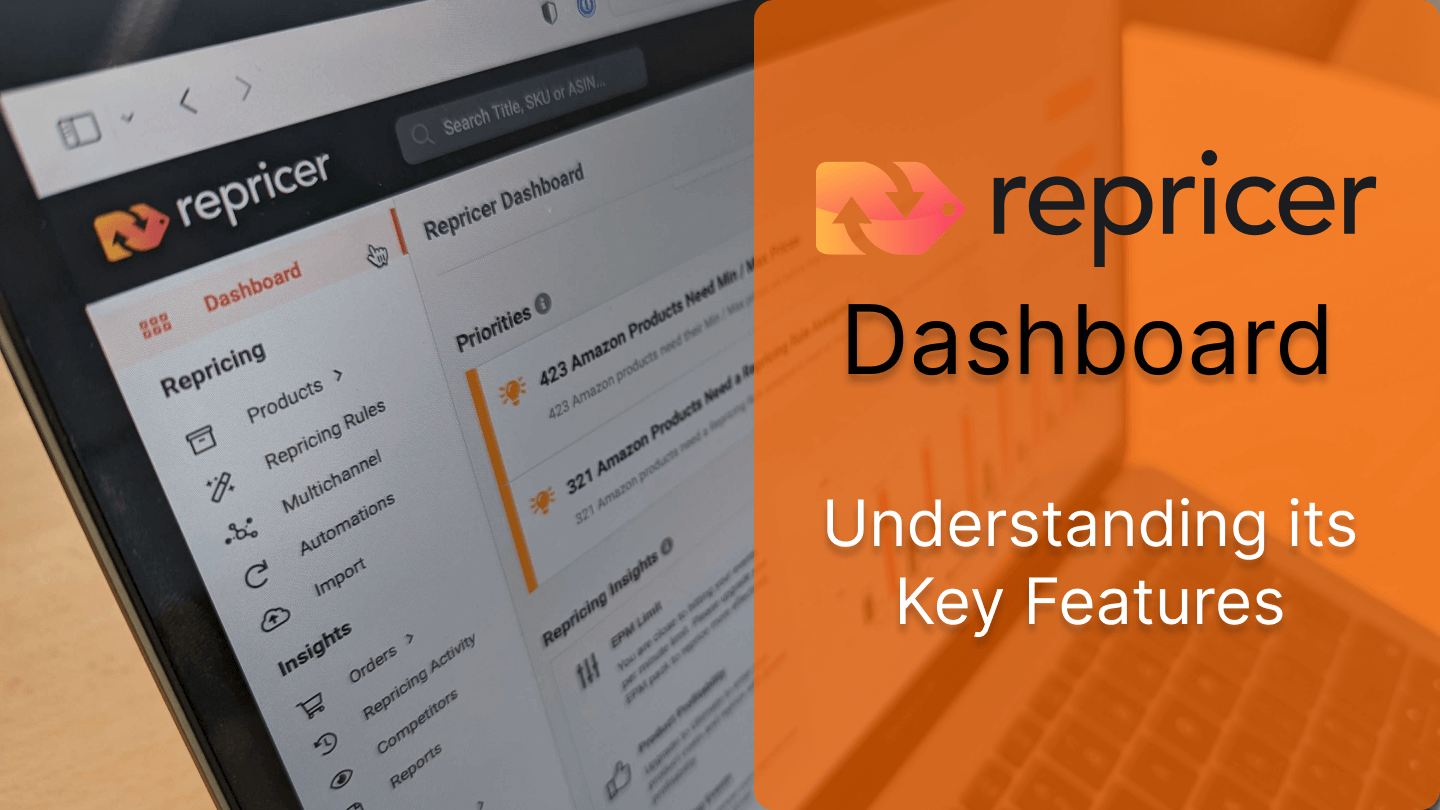
In questo articolo parleremo della dashboard di Repricer, delle sue caratteristiche principali e di ciò che puoi aspettarti da essa. Riceverai tantissime informazioni importanti sull’andamento del tuo repricer e ti suggerirà le azioni che potrai intraprendere rapidamente per migliorare le prestazioni dei tuoi prodotti. Di seguito analizzeremo ogni sezione per capire cosa comporta e come può aiutarti a prendere decisioni informate per sviluppare la tua strategia di repricing.
Panoramica della testata del prodotto

Questa sezione fornisce una rapida panoramica dei dettagli del tuo abbonamento e del tuo prodotto. In primo luogo viene mostrato il piano che stai utilizzando con Repricer. A destra, viene indicato il numero di inserzioni di prodotti attualmente importate.
Repricer offre 4 piani tra cui scegliere. Ogni piano prevede un numero massimo di inserzioni che puoi aggiungere:
- Espresso: 5.000 annunci
- In più: 50.000 annunci
- Ultimate: 250.000 inserzioni (come mostrato)
- Estremo: 1 milione di annunci
Oltre a questo, tra gli annunci di prodotti totali, abbiamo i prodotti configurati. Questi prodotti configurati sono gli annunci di prodotti che sono impostati e pronti per il repricing. Verranno visualizzati anche i prodotti attualmente non configurati che necessitano semplicemente di un prezzo minimo/massimo o di una regola di riprezzamento. Infine, a destra, abbiamo una sezione che mostra quanti prodotti stanno vincendo la Buy Box.
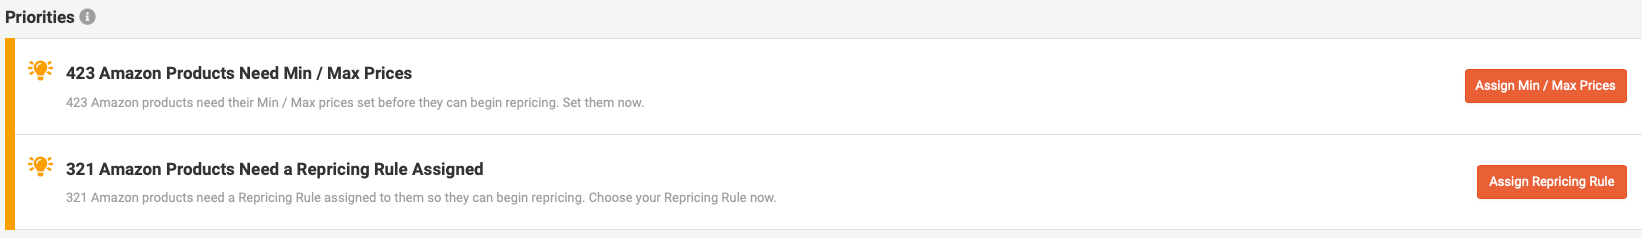
Priorità
Approfondimenti sul repricing
Ci sono alcune funzioni chiave di cui parleremo all’interno di Repricing Approfondimenti che possono mostrare rapidamente importanti metriche sull’andamento delle tue vendite e dei tuoi ricavi.
Limite EPM
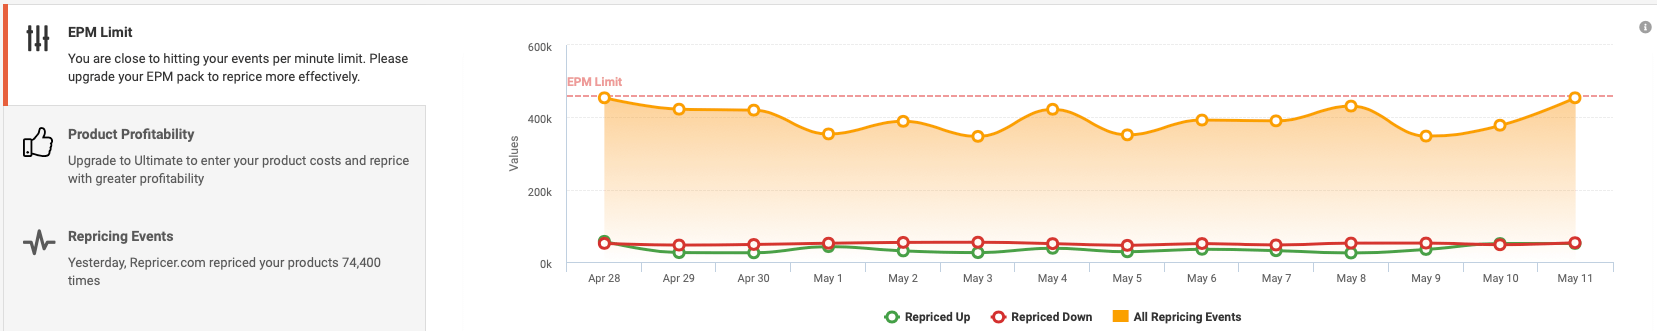
Il primo elemento che abbiamo sotto gli Approfondimenti sul repricing è il limite EPM. EPM si riferisce a un “evento al minuto”. Un evento si verifica quando una variazione di prezzo fa sì che il tuo Amazon, eBay o un altro marketplace in cui sei impostato invii una notifica a Repricer.com. È meglio tenere d’occhio gli eventi al minuto perché c’è un limite al tuo EPM a seconda del pacchetto di prezzi che utilizzi.
Il grafico dell’EPM è anche interattivo, quindi se vuoi rimuovere gli eventi e guardare solo il repricing effettivo, puoi farlo. Potrai anche vedere le volte in cui i tuoi prodotti hanno subito un aumento di prezzo, in verde, e le volte in cui hanno subito una riduzione di prezzo, in rosso.
Redditività del prodotto
La funzione di redditività dei prodotti ti fornirà un’analisi dettagliata della redditività dei tuoi prodotti. Per vederla dovrai importare i tuoi costi in Repricer.com, che è disponibile con il piano ultimate o superiore.
Eventi di riprezzamento
Poi ci sono gli eventi di repricing, simili a quelli dell’EPM. Questo mostra quante volte i tuoi prodotti sono stati rivalutati sia al rialzo che al ribasso.
Acquista la proprietà del box
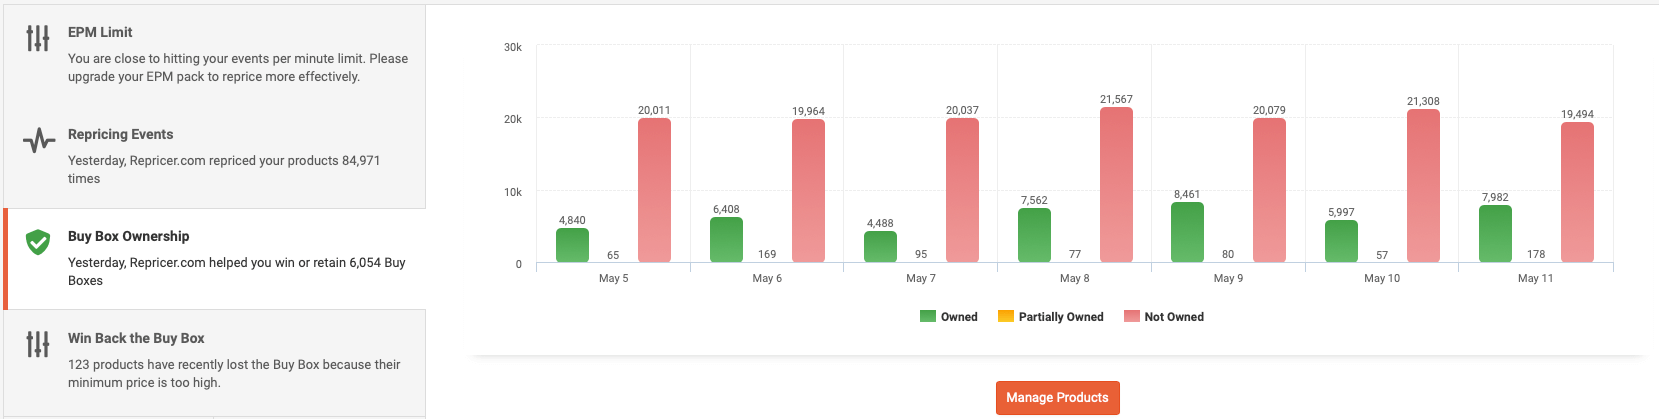
Puoi anche visualizzare la proprietà della tua Buy Box: in questo modo potrai vedere i prodotti che stai vendendo e che sono attualmente vincenti nella Buy Box, quelli che non sono presenti nella Buy Box o anche i prodotti che possiedono parzialmente la Buy Box.
Riconquista la Buy Box
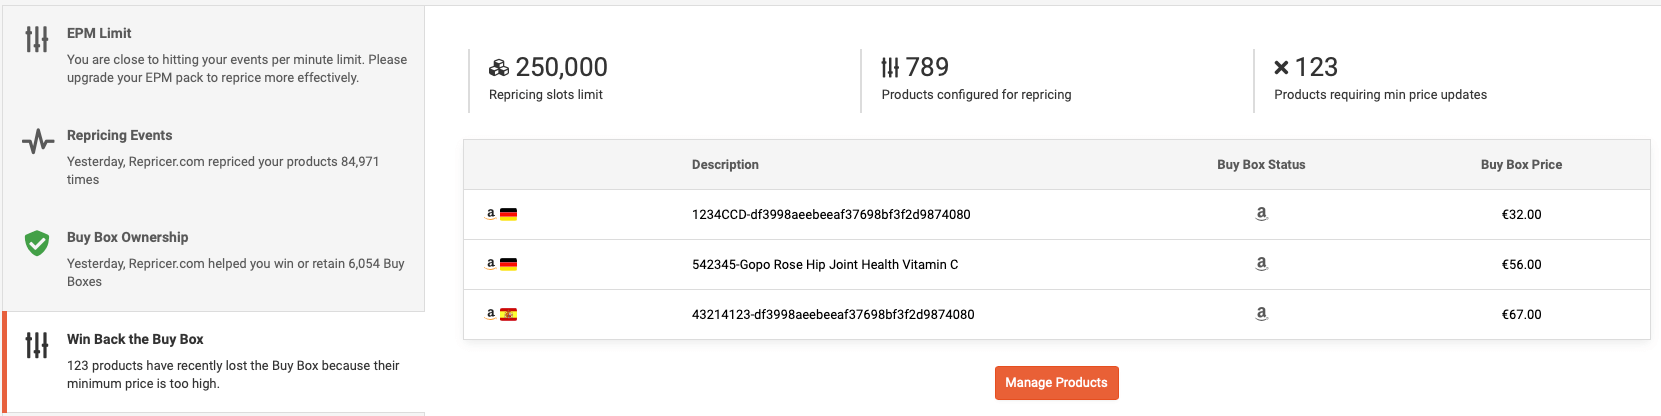
Questa sezione ti offre l’opportunità di riconquistare la Buy Box. Qui vengono visualizzati i prodotti che recentemente hanno perso la Buy Box. Cliccando sul pulsante “Gestisci i prodotti”, verrai indirizzato direttamente a questi prodotti, dove potrai intervenire con un prezzo più aggressivo per riconquistare la Buy Box.
Acquista Box Predictor
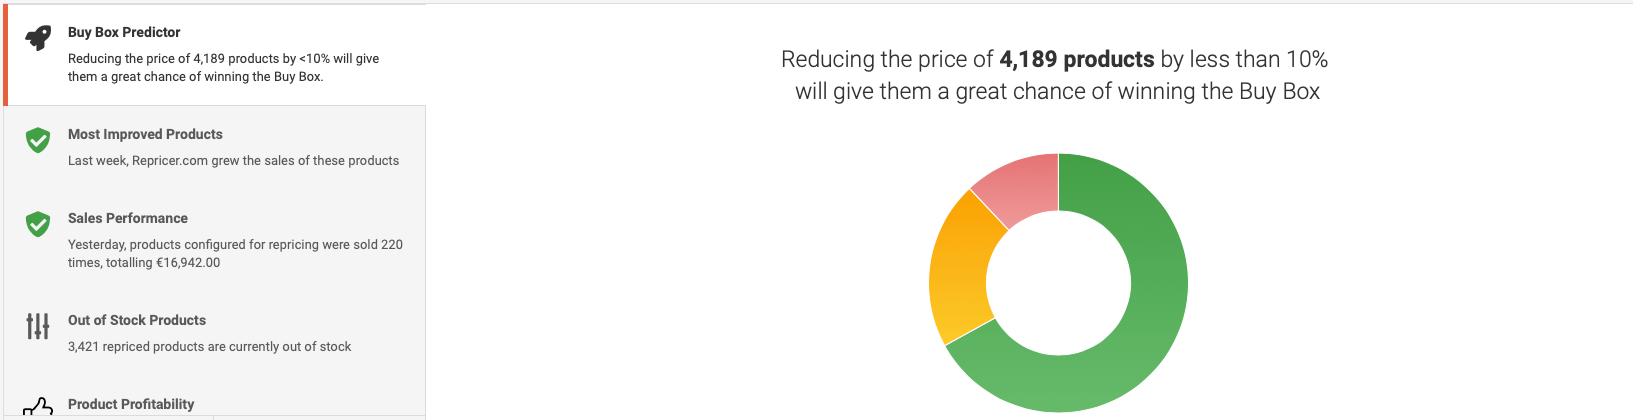
Il Predittore Buy Box fornisce informazioni sulla probabilità che i tuoi prodotti vincano la Buy Box. I prodotti nell’area verde hanno un’ottima probabilità, quelli nell’area arancione hanno una probabilità media, infine quelli nell’area rossa possono avere una probabilità molto bassa di vincere la Buy Box.
L’aspetto interessante è che puoi cliccare su una qualsiasi di queste aree colorate per accedere a un elenco di prodotti. Quindi potrebbe essere utile agire sui prodotti elencati nell’area rossa e sviluppare una strategia di repricing su di essi. Basta cliccare su questi prodotti e potrai assegnare loro un tipo di regola diversa per aiutarli a riprezzare in modo più competitivo.
I prodotti più migliorati
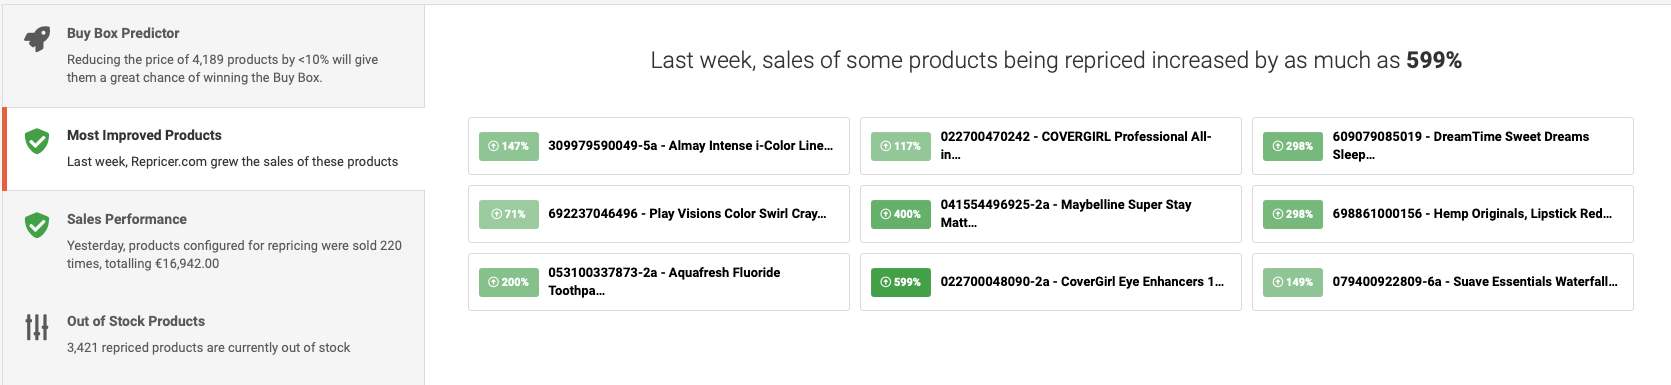
Questa sezione offre una rapida panoramica dei tuoi prodotti più performanti di recente.
Prestazioni di vendita
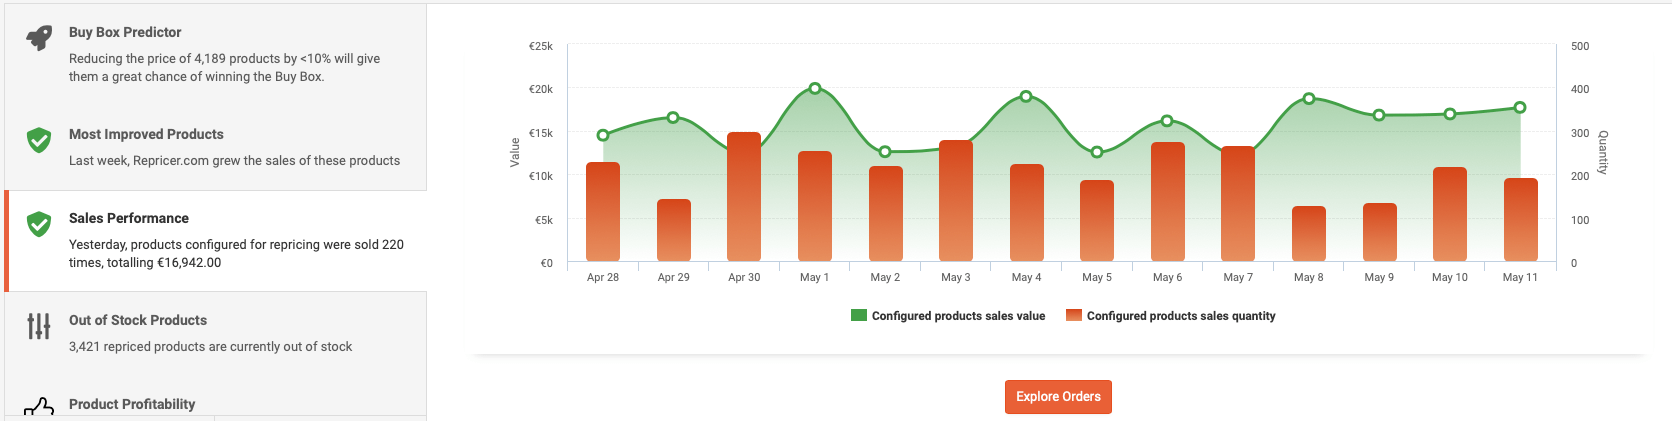
Il grafico delle prestazioni di vendita riassume le vendite totali dei tuoi prodotti configurati. Il numero di vendite effettuate è indicato nelle colonne rosse e il grafico lineare in verde mostra il valore in dollari di queste vendite.
Prodotti esauriti
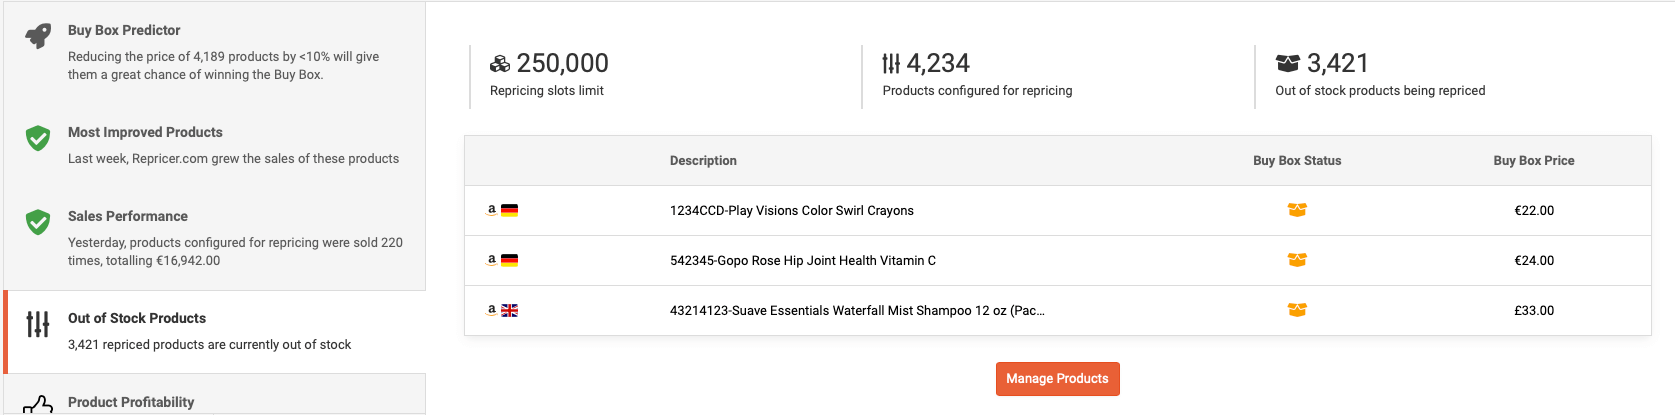
Nella sezione Prodotti esauriti puoi vedere quali prodotti sono attualmente esauriti. Cliccando su “Gestisci i prodotti” visualizzerai un elenco di questi prodotti e potrai aumentare il loro prezzo minimo in modo che quando torneranno in stock avranno un prezzo più alto oppure potrai assegnare loro una regola speciale.
Analisi delle vendite dei prodotti
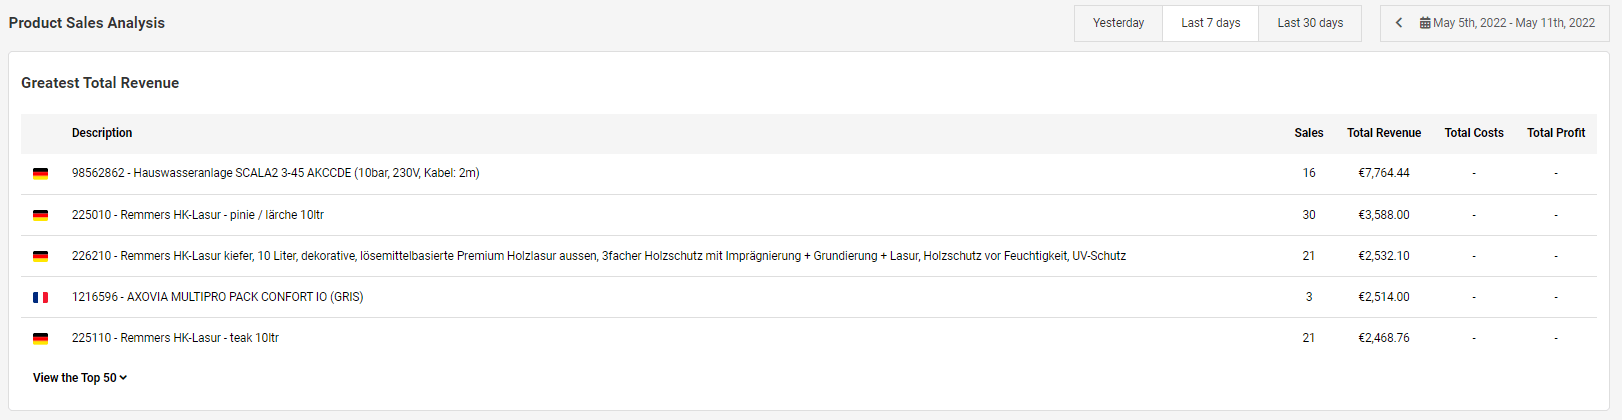
Puoi anche visualizzare un’analisi dei tuoi 50 prodotti principali in base al maggior fatturato totale. Se fai clic sul pulsante “Visualizza i 50 prodotti più venduti”, l’elenco completo viene visualizzato automaticamente e puoi visualizzare le vendite totali di ieri, degli ultimi 7 giorni, degli ultimi 30 giorni o, se preferisci, di un periodo personalizzato. Se hai inserito anche i costi, ti verrà mostrato il profitto totale per quel determinato periodo.
Andamento della redditività
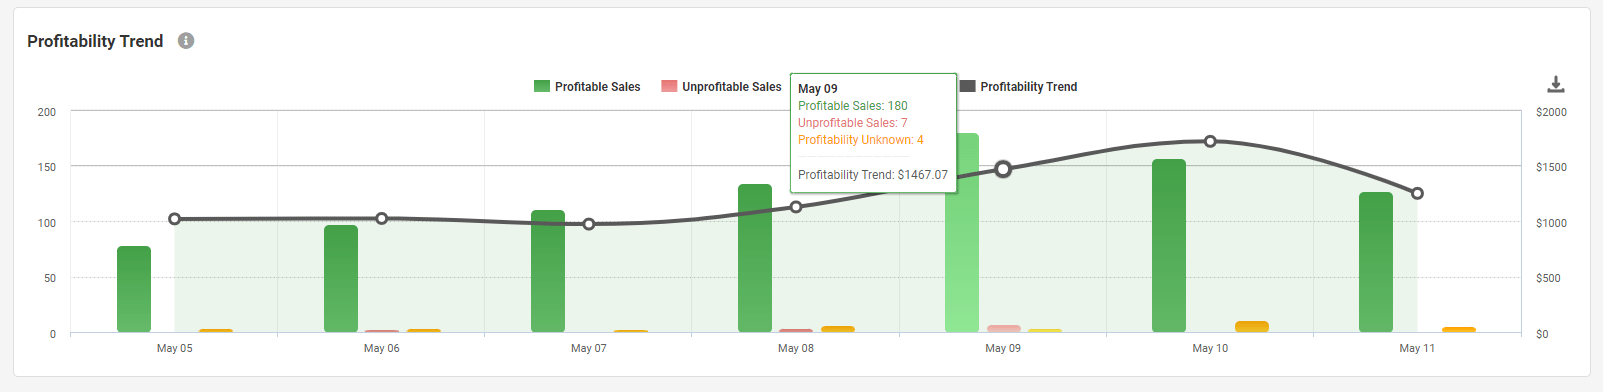
Infine, se hai incluso i costi, potrai vedere una panoramica dell’andamento della redditività: le vendite redditizie sono indicate nelle colonne verdi e quelle non redditizie in rosso. Tutte le vendite in cui la redditività è sconosciuta sono semplicemente quelle in cui non sono stati inseriti i costi. Quindi, aggiungendo semplicemente i costi a ciascuno di questi prodotti, potrai capire meglio come si sta comportando la tua strategia di vendita nel suo complesso.
Sintesi
Questo è tutto ciò che devi sapere e capire nella dashboard di Repricer. È consigliabile fare sempre riferimento alla tua dashboard di tanto in tanto, in quanto puoi ottenere suggerimenti molto utili sulle azioni da intraprendere per i tuoi prodotti e sul loro andamento, ottenendo allo stesso tempo approfondimenti davvero potenti sulle tue entrate e sulle tue vendite.
Se non ti sei ancora iscritto alla prova gratuita di 14 giorni, questo è il momento giusto. Repricer.com permette ai venditori di offrire prezzi sempre competitivi su più marketplace e webstore. Il software di repricing automatico analizza la domanda di prodotti, i prezzi dei concorrenti, le opportunità di Buy Box e molto altro ancora per garantire che i venditori siano in vantaggio sulla concorrenza.